Debugging Claude Code Agents: Reading Transcripts, Tracing Tool Calls, and Finding Where Your Agent Goes Wrong
Scored daily by a customisable AI persona to surface the most relevant engineering leadership news.
Practical debugging guide for Claude Code agents, directly actionable for AI agent workflows.
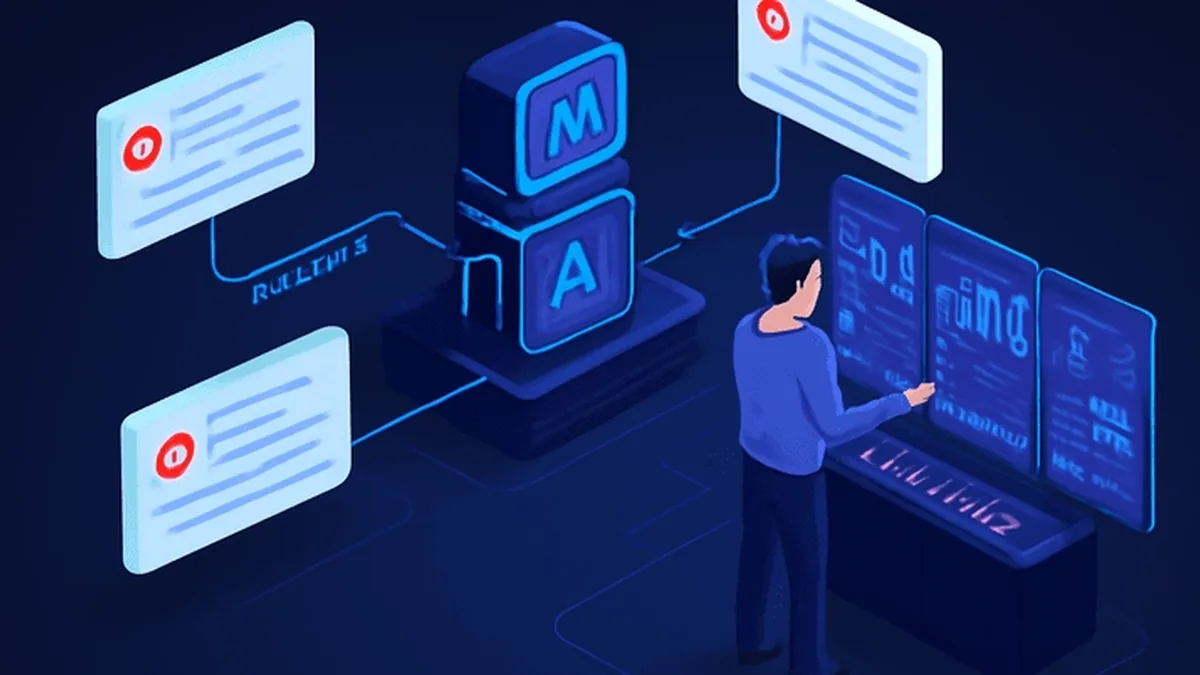
Debugging Claude Code agents requires capturing the complete execution path—every tool call, reasoning step, and context state transition—because agent execution is non-deterministic and context-dependent, unlike traditional synchronous code. Common failure modes include silent context overflow, hallucinated schema fields, and reasoning loops, which can be surfaced by reading transcripts that reveal the model's reasoning before each tool call, not just the final output. Production observability tools like LangSmith, Arize Phoenix, and Braintrust offer different tradeoffs for trace inspection, local iteration, and evaluation-driven debugging, while custom TypeScript trace analyzers enable domain-specific pattern detection.